This report presents a list of all hosts and the users that have accessed them, as identified by the Daily_Host_Alert LCE event.
This report displays details on all warnings and errors identified in the environment.
The report has two main customizable sections.
The error section contains tables that present the reviewer with all errors found. By default, it is set up for display of the top 10 errors by count, and/or the last 24 hours by time. This can be easily modified to extend timeframe or display parameters. This section presents detected errors using five different methods.
This report displays details on new user events that have been found in your environment. The report is broken down into 3 main areas.
The first area is Graphs and Trends.
Graphs and Trends contains trend data on logins and login failures over a 7 day period, new users, new network users, and VPN logins from unusual sources.
This area of the report contains graphs and trend data on logins and login failures over a 7 day period, new users, new network users, and VPN logins from unusual sources.
For customers who use Nessus for vulnerability scanning and then move to SecurityCenter, vulnerability reporting may be somewhat challenging. This report mimics the look and feel of a typical Nessus scanner vulnerability report.
Like a Nessus scanner report, this report contains a Table of Contents, iterates host information, and provides a results summary and vulnerability details for all hosts scanned.
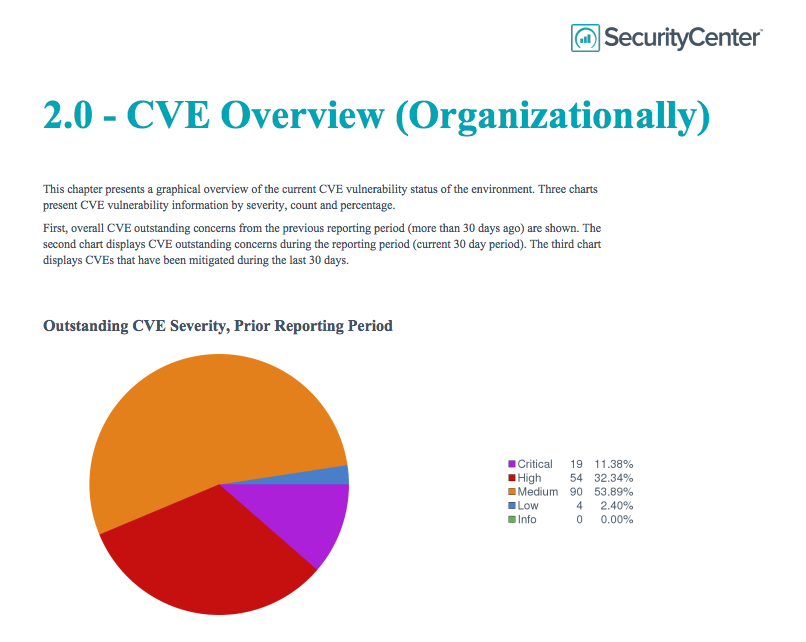
This high level report displays CVE vulnerability details for the years 2010 - 2014.
The first chapter provides a graphical overview of CVE vulnerabilities in 3 pie charts that represent both vulnerabilities and recently mitigated vulnerabilities. Presented is a graphical overview of the current CVE vulnerability status of the environment. These three charts present CVE vulnerability information by severity, count and percentage.
This report template leverages Nessus PCI system configuration results to track which PCI DSS requirements are compliant or non-compliant.
If you need to track which PCI requirements your group is compliant with and you are performing credentialed Nessus configuration audits of your systems, then this SecurityCenter report template can be used to track which requirements are currently being met or not.
This report displays event statistics leveraging the capabilities of Tenable Netflow Normalized Events. This event data is correlated to produce a series of pie charts, tables, and trends lines to display statistical data. The report is based on the the components present in the NetFlow Monitor Dashboard.
Netflow data that is being forwarded to Tenable’s LCE includes ports, source and destination IP address. The chapters in this report include:
Top Talkers (All Traffic)