This report template identifies the details on systems vulnerable to the newly identified HeartBleed vulnerability. Using all the tools available to SecurityCenter users, Tenable has several methods of identifying vulnerable systems.
This report leverages the Tenable FortiGate Best Practices Audit and other plugins to provide security settings and other useful information on FortiGate device configuration to an administrator.
Requirements:
Security settings included in this audit:
This report displays details on Administrator accounts that have been found in your environment via LCE and active Nessus scanning.
Provided are details on:
This can be easily configured to your own environment if required by altering the filter for vulnerability text.
For customers who use Nessus for vulnerability scanning and then move to SecurityCenter, vulnerability reporting may be somewhat challenging. This report mimics the look and feel of a typical Nessus scanner vulnerability report. This report is similar to a previously released report titled 'Nessus Scan Report'. This report limits the results to the Top 5 Vulnerabilities, for each severity level, across the scanned hosts.
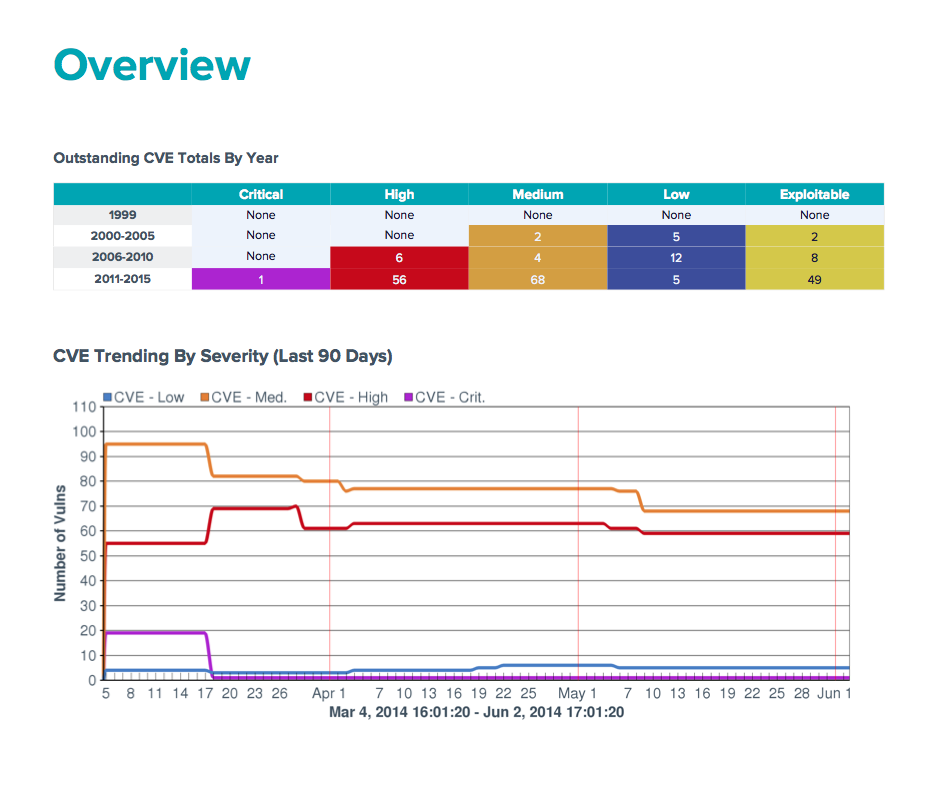
This report displays CVE vulnerability information. The first section of the report provides graphical CVE summary results in 5 year blocks by severity. It is followed by a CVE Trend over the last 90 days, a mitigated CVE total bar chart, and a pie chart of existing CVE severity vulnerabilities for the last 5 years.
Chapter two displays a table of all CVE Vulnerabilities by CVE ID, the severity, and number of hosts/totals that contain the vulnerability.
Three charts are presented:
This Report and all associated components require the following:
This report leverages the Tenable FireEye Best Practices Audit, and Dynamic Asset to provide security settings and other useful information on FireEye device configuration to an administrator.
Requirements are:
This report displays incident response details on Systems that have been found in your environment to have active intrusion events. Intrusion events are events that are triggered by plugin 800125 - Long Term Intrusion Activity, or 800017 - Intrusion Statistics..
This report contains information that provides an overview of collected events. This provides the analyst with many different methods to quickly locate actionable context in your data. Its counterpart is the Event Analysis Dashboard.