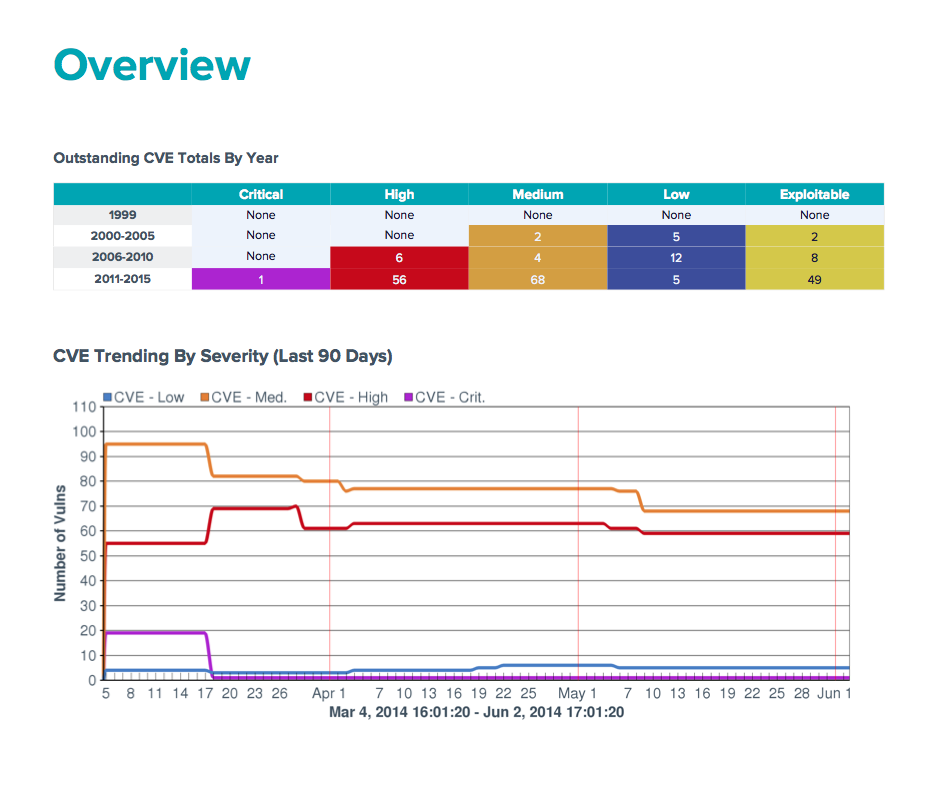
This report displays CVE vulnerability information. The first section of the report provides graphical CVE summary results in 5 year blocks by severity. It is followed by a CVE Trend over the last 90 days, a mitigated CVE total bar chart, and a pie chart of existing CVE severity vulnerabilities for the last 5 years.
Chapter two displays a table of all CVE Vulnerabilities by CVE ID, the severity, and number of hosts/totals that contain the vulnerability.
Three charts are presented:


